Tide Gauge Example
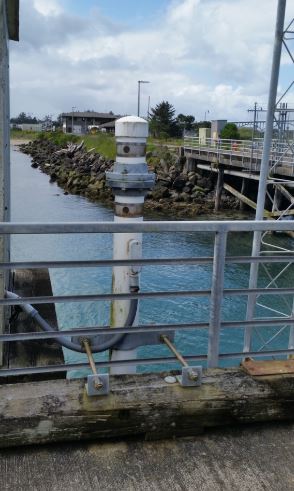
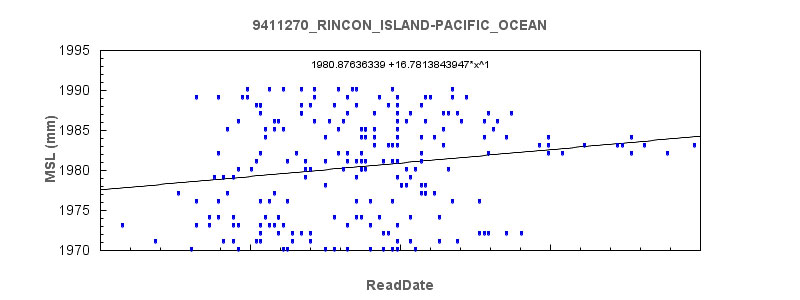
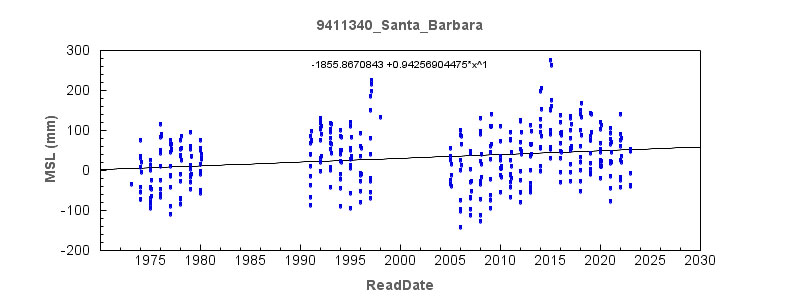
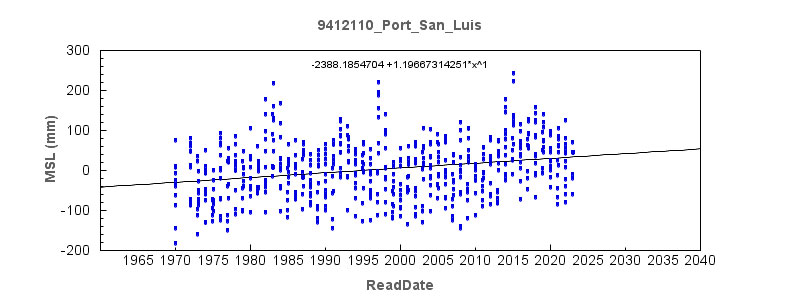
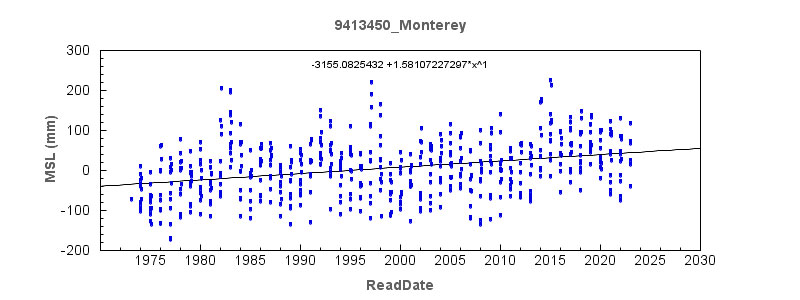
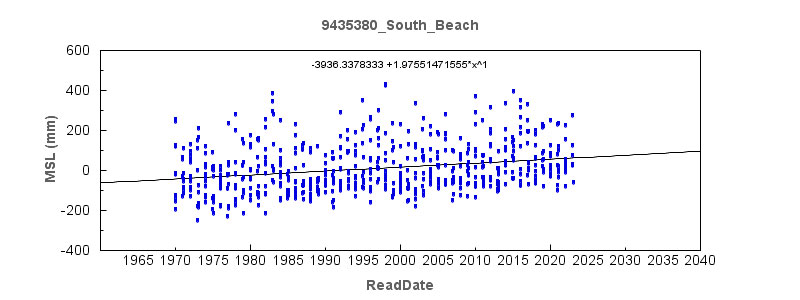
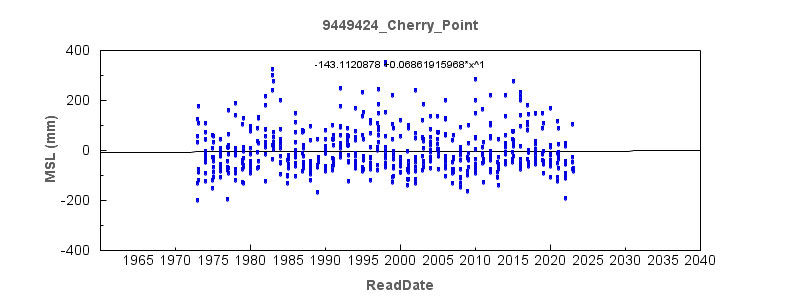
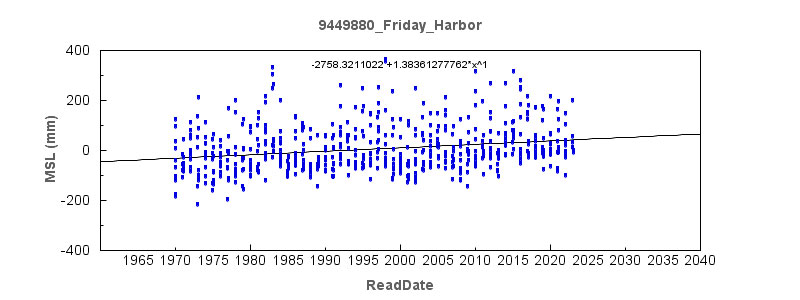
Below is an example of a typical Tide Gauge.
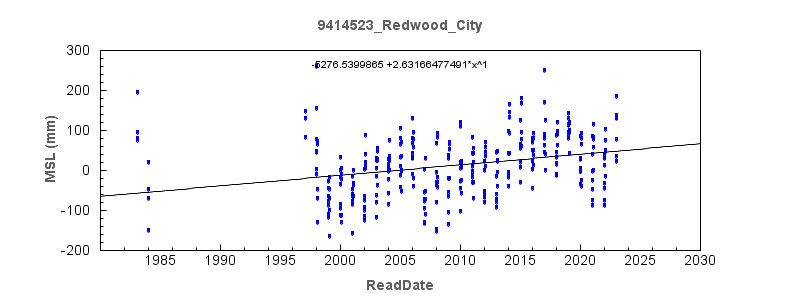
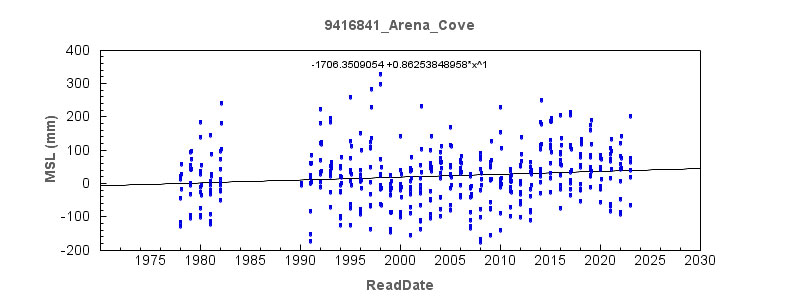
Global sea level has been rising over the past century and the rising rate has increased in recent decades because of global warming. Sea level plays a critical role in wetland loss, coastal flooding, shoreline erosion, and flooding hazards from storms. In the long term, rising sea level also creates stress on groundwater systems and coastal ecosystems. As the sea-level rises, saltwater intrudes into freshwater aquifers, many of which sustain coastal ecosystems and provide water for municipal and agriculture use.
Sea level is primarily measured using tide gauge stations along the coasts and satellite laser altimeters. The Center for Operational Oceanographic Products and Services (COOPS) at National Oceanic and Atmospheric Administration (NOAA) operates the tide gauge stations along the west coast. In total, there are 28 tide gauge stations along the west coast of the U.S in this study. These measurements are monthly averages, which removes the effect of higher frequency phenomena to compute an accurate linear sea-level trend.
Instead of measuring ABSOLUTE sea-level changes, tide gauge measurements provide information on RELATIVE sea-level changes. This is because tide gauges measure sea levels relative to reference benchmarks fixed on the local land surface through repeat leveling surveys. This project uses tide gauges information relative to GPS stations with continuous daily sampling.
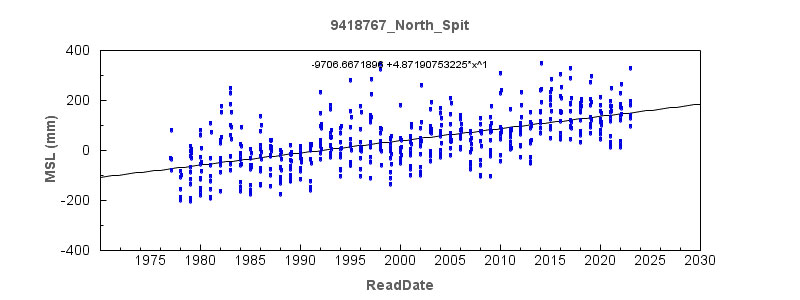
Below is an example of a typical Tide Gauge.
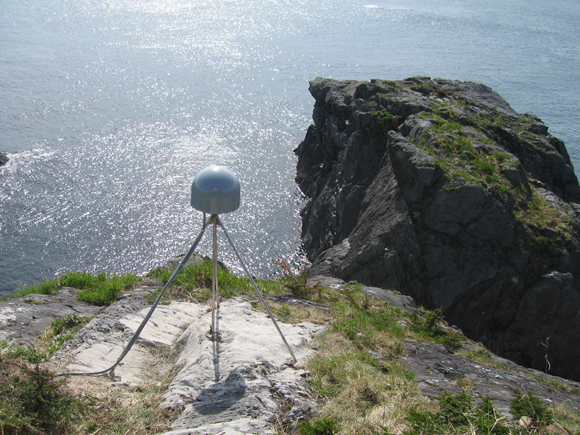
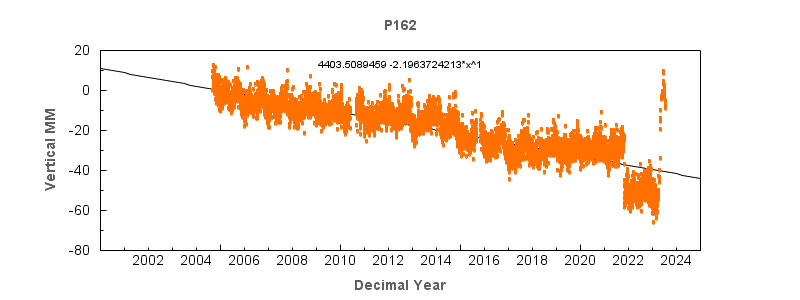
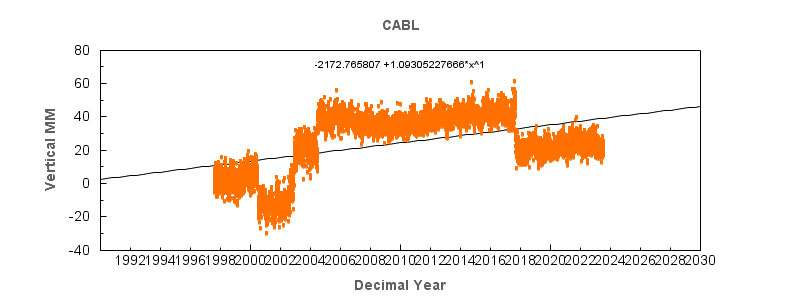
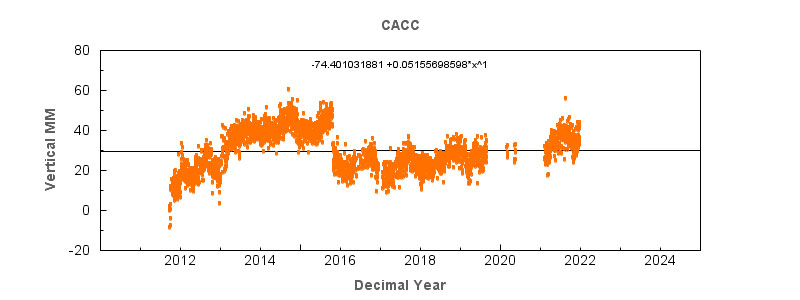
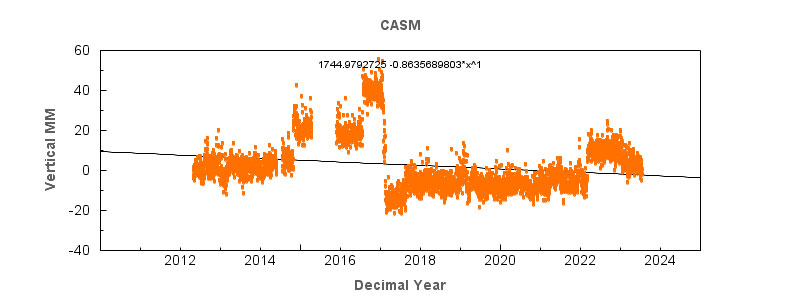
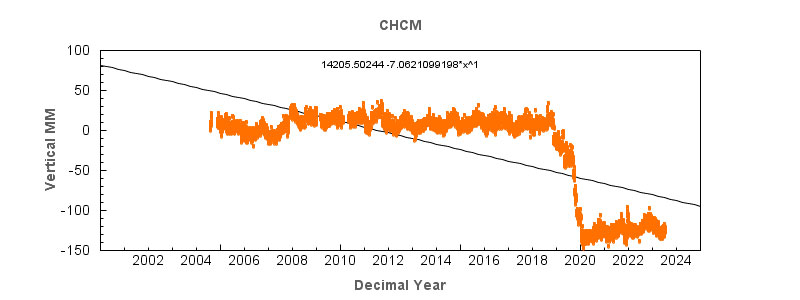
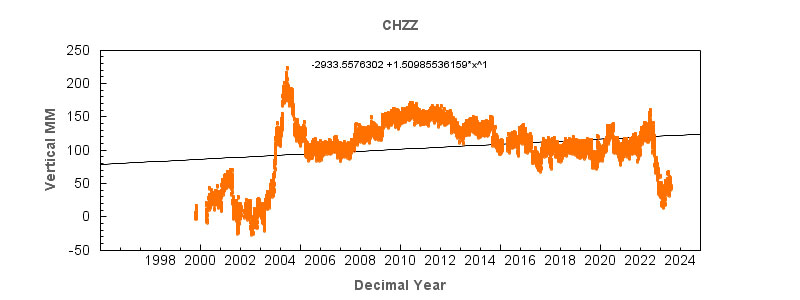
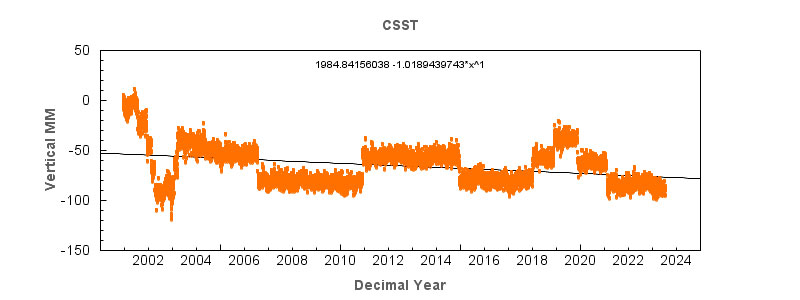
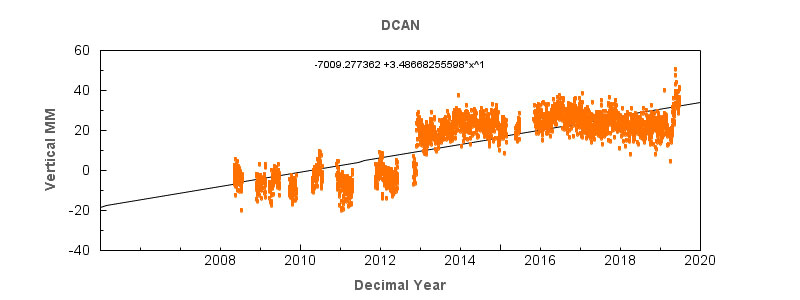
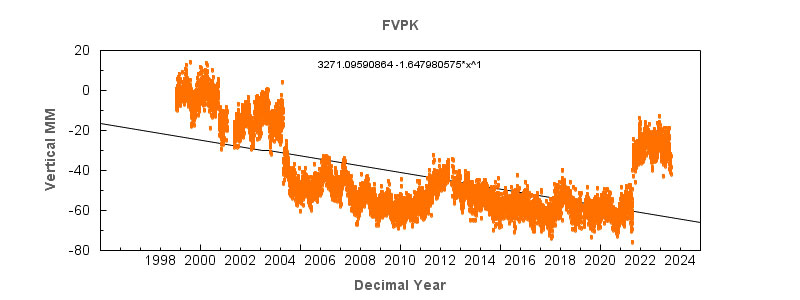
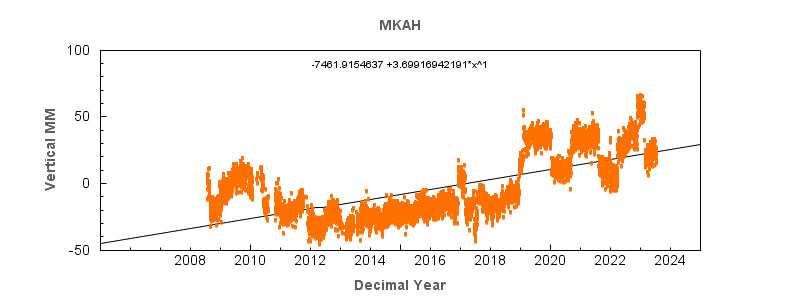
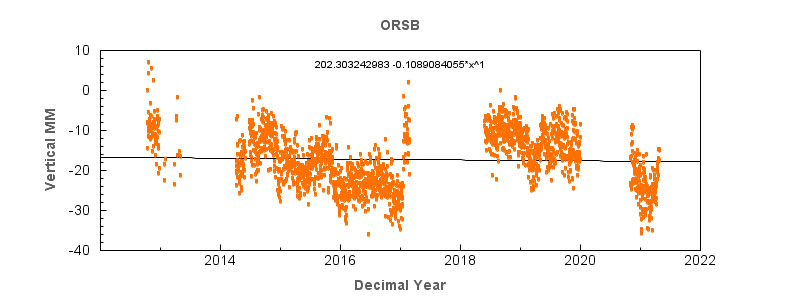
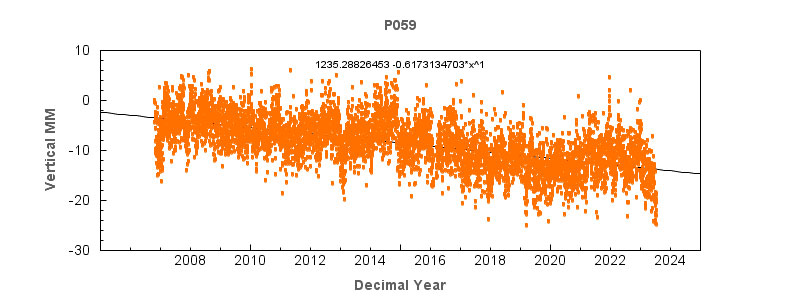
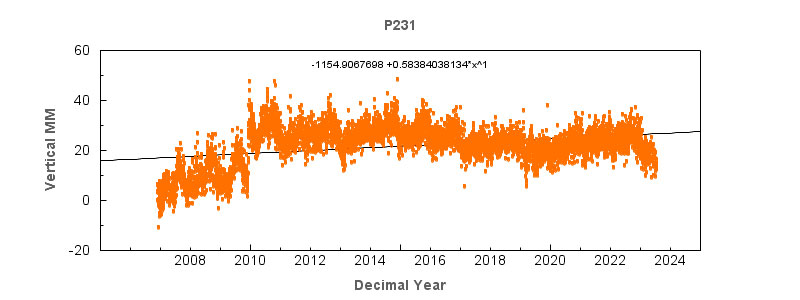
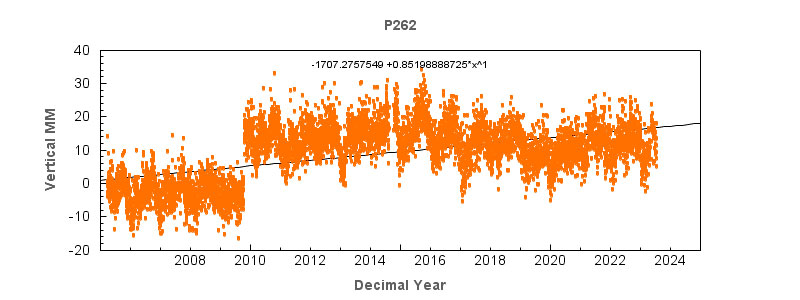
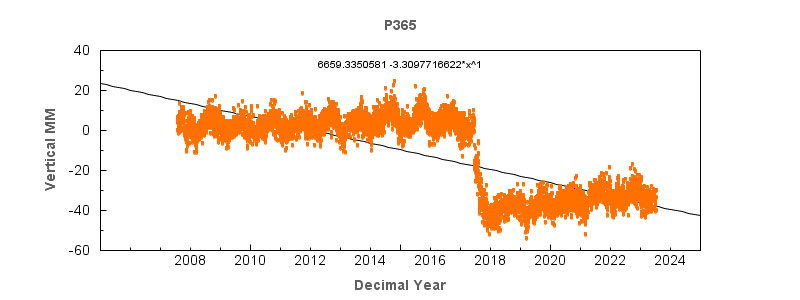
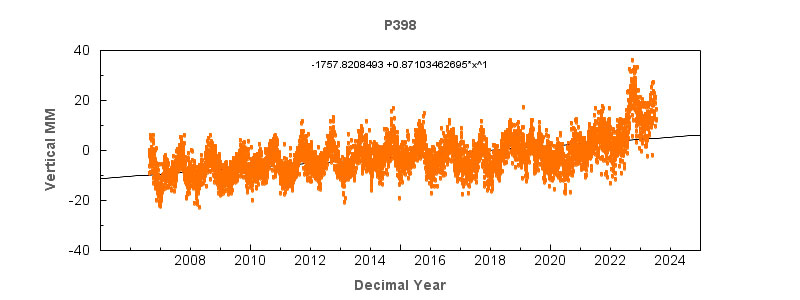
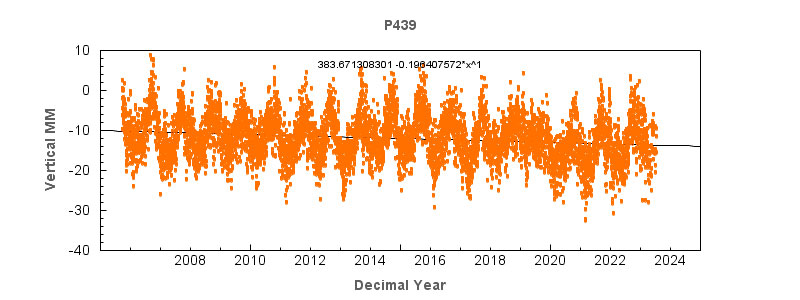
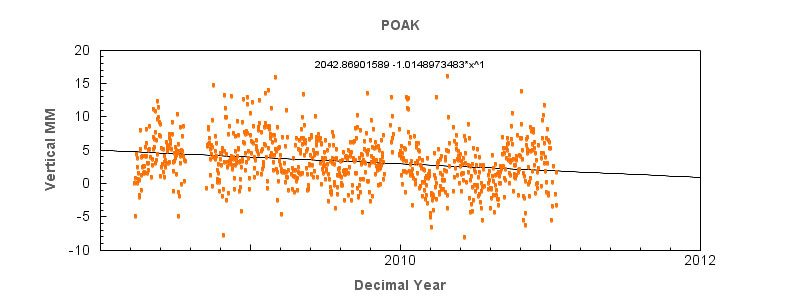
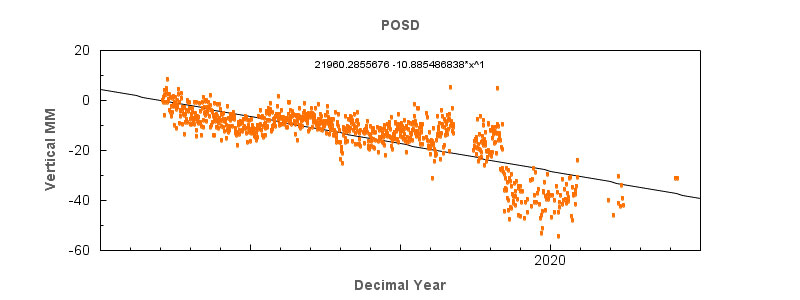
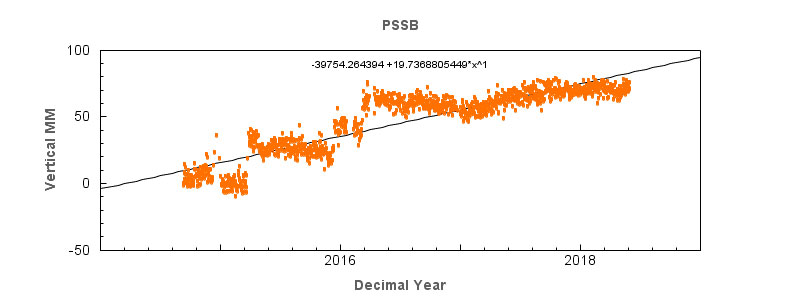
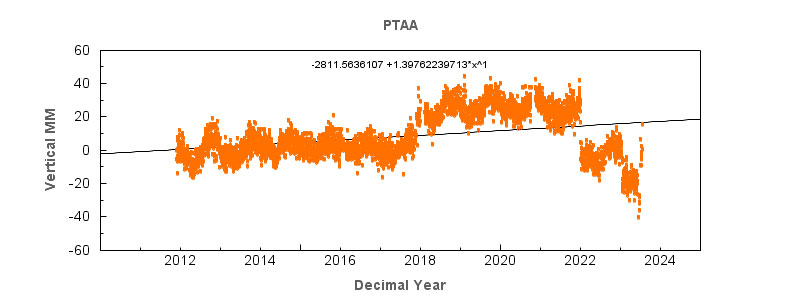
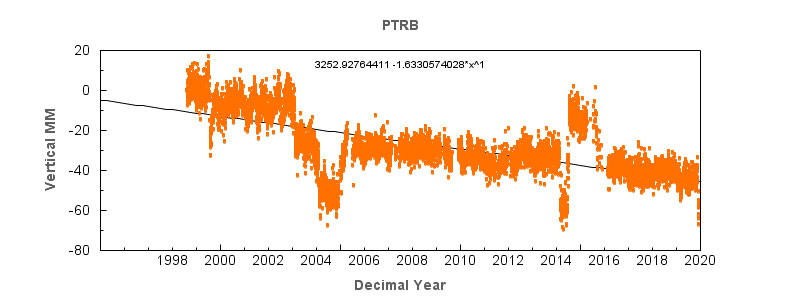
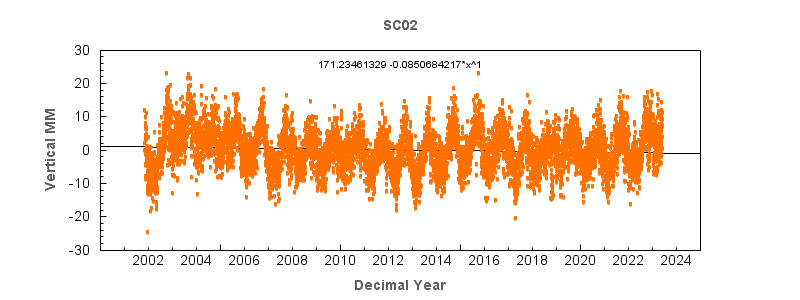
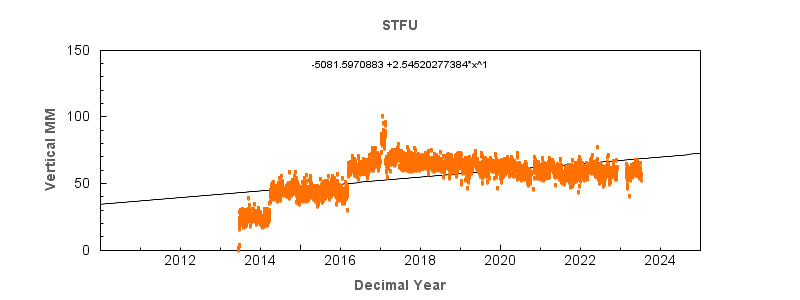
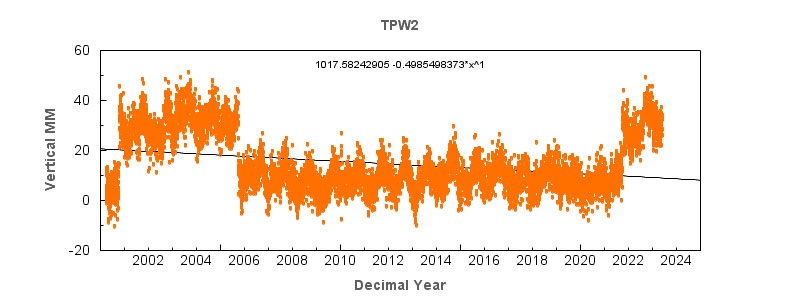
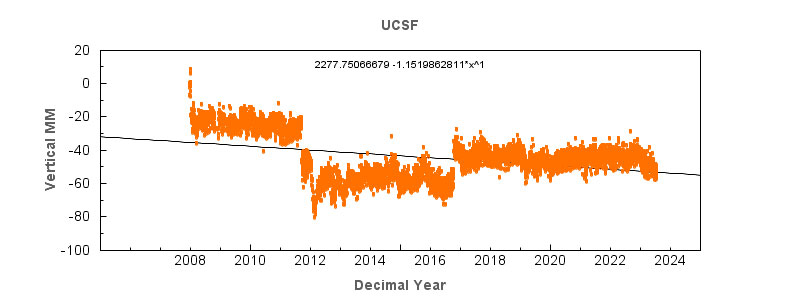
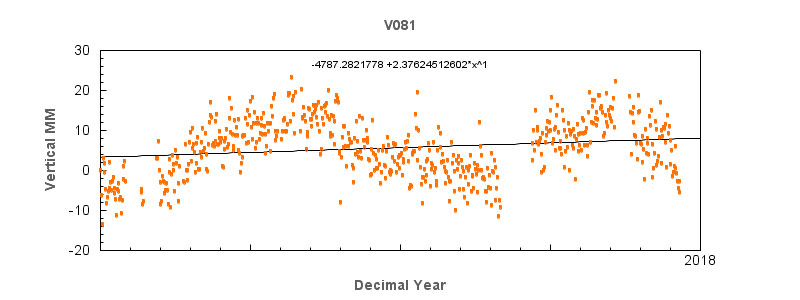
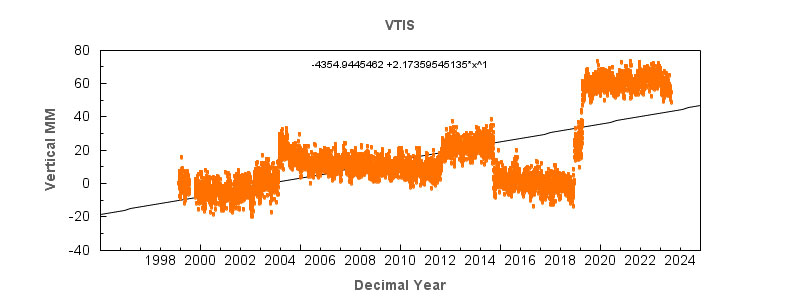
Below is an example of a typical GPS Station.
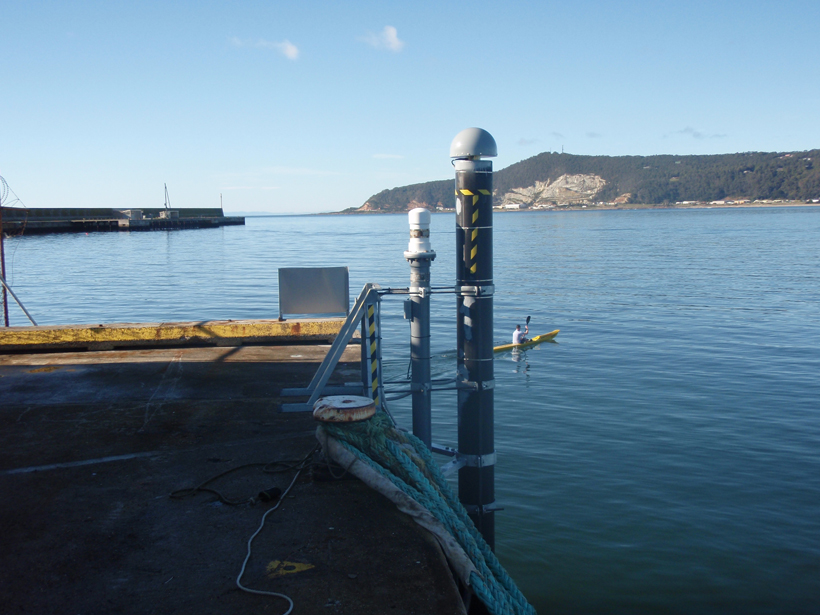
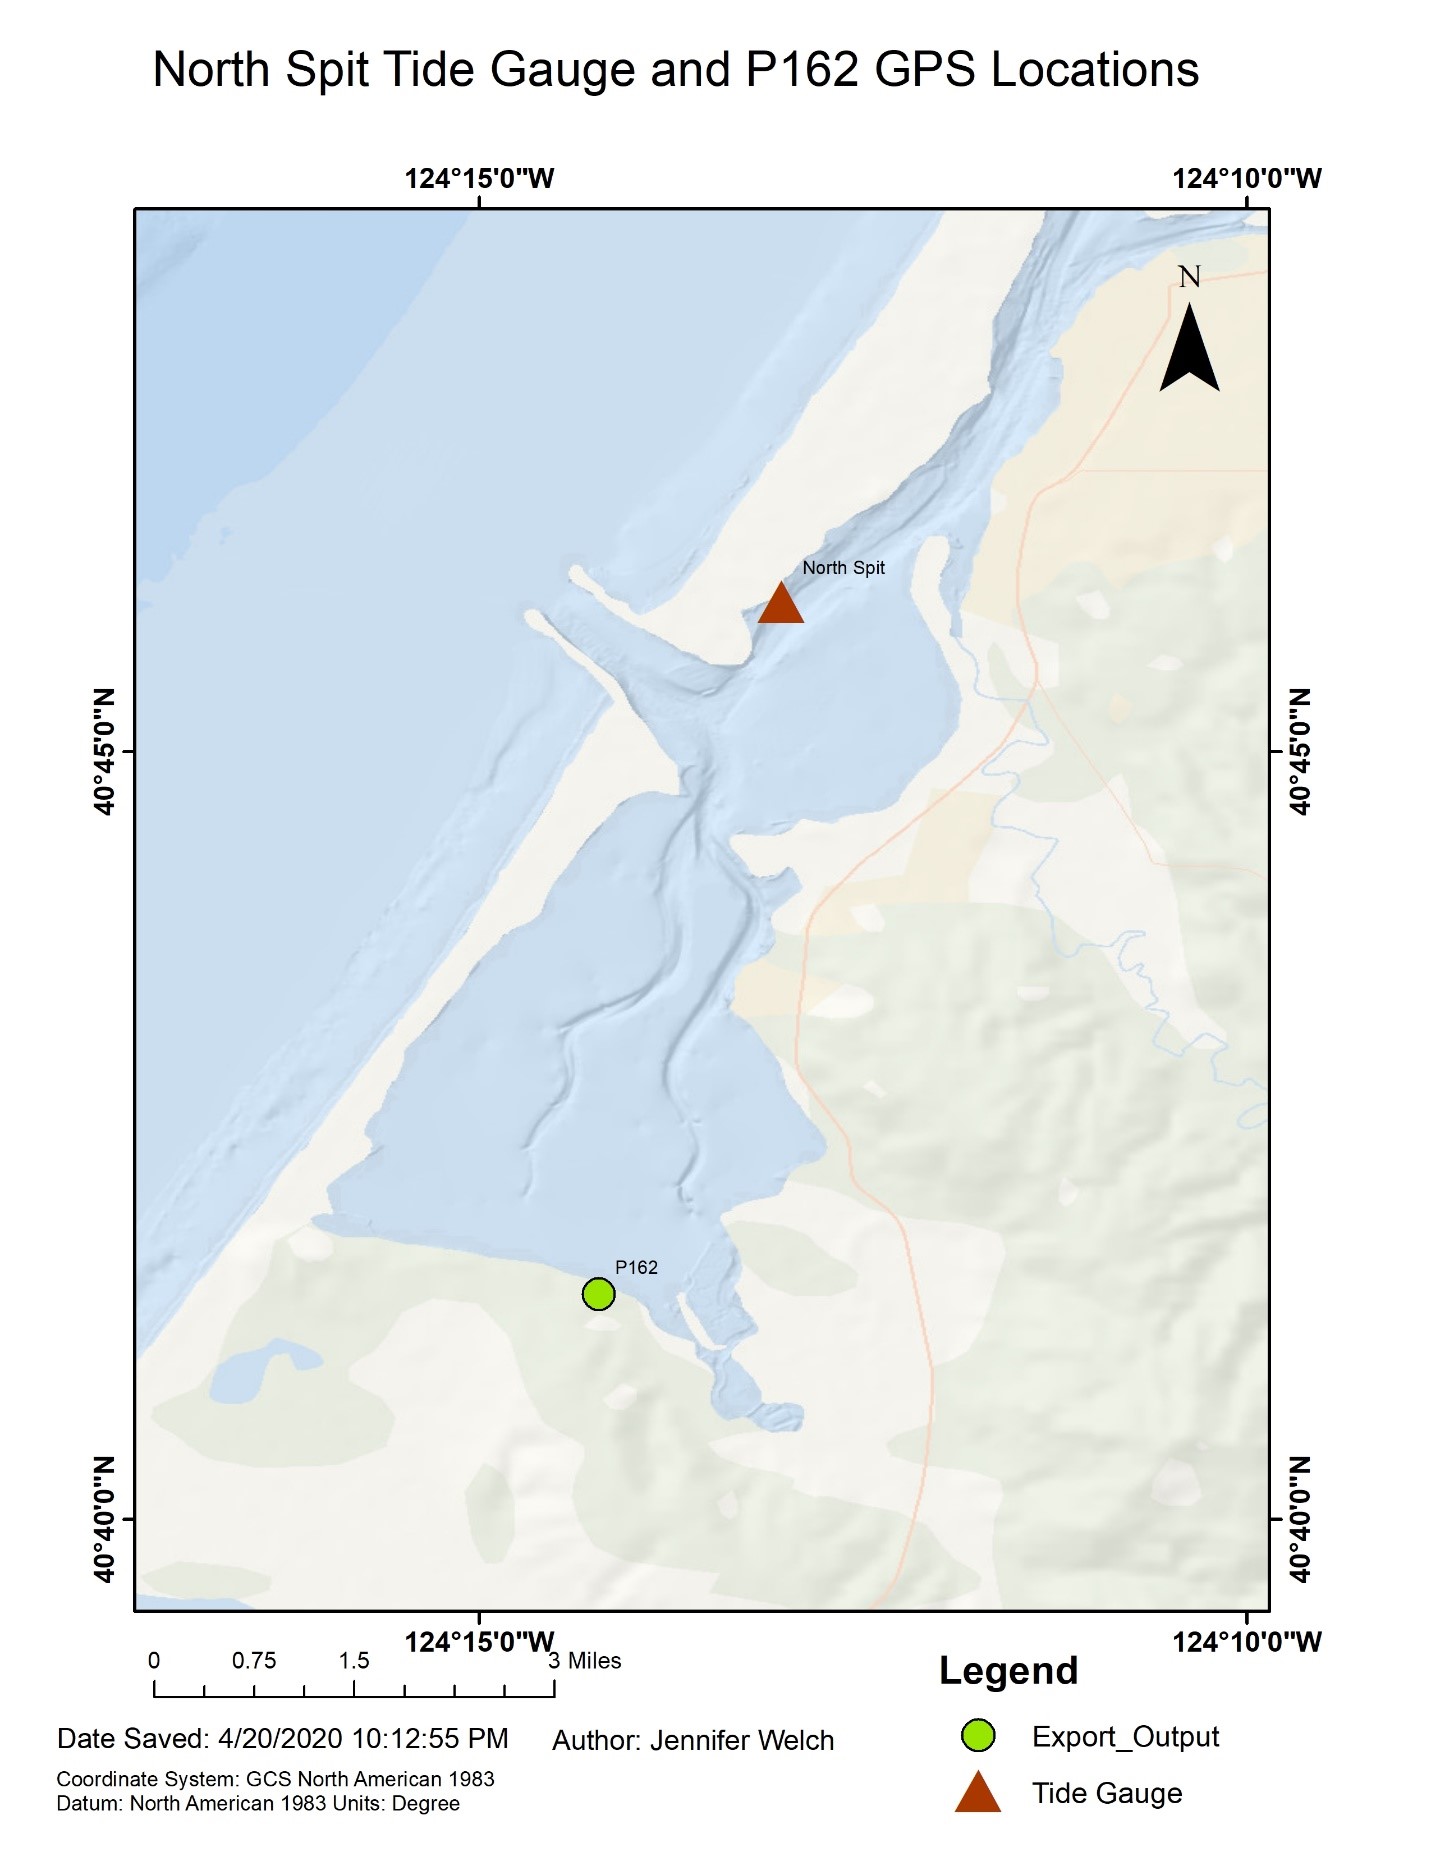
Below is an example of a typical Tide Gauge and GPS Station together.
Data Retrieval Methods and Storage:
Additional Data Retrievel and API information:
The following technology tools were used in this project:
Below is a list of the database scripts included in the download.

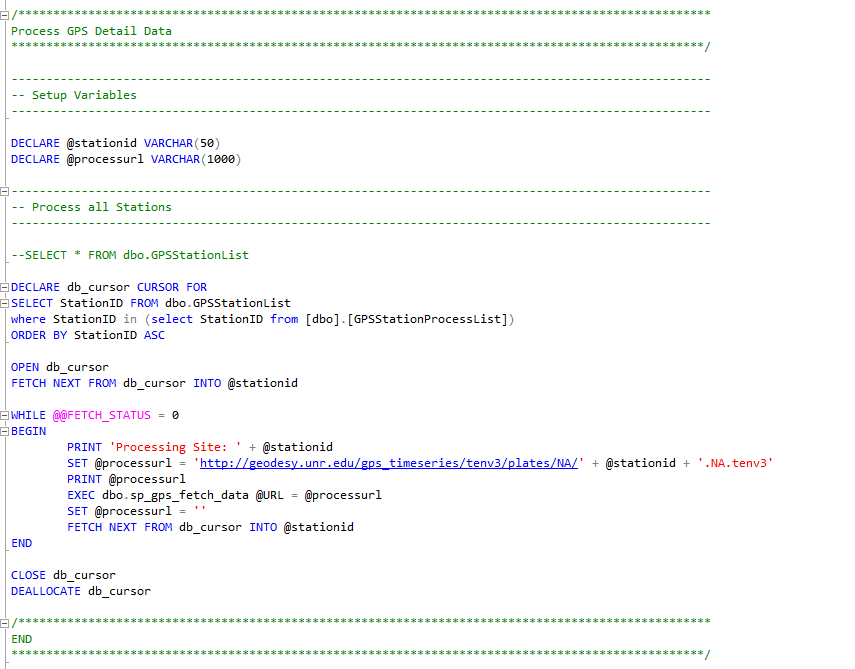
Below is a snipet example of the SQL script used to retrieve the GPS Station data.
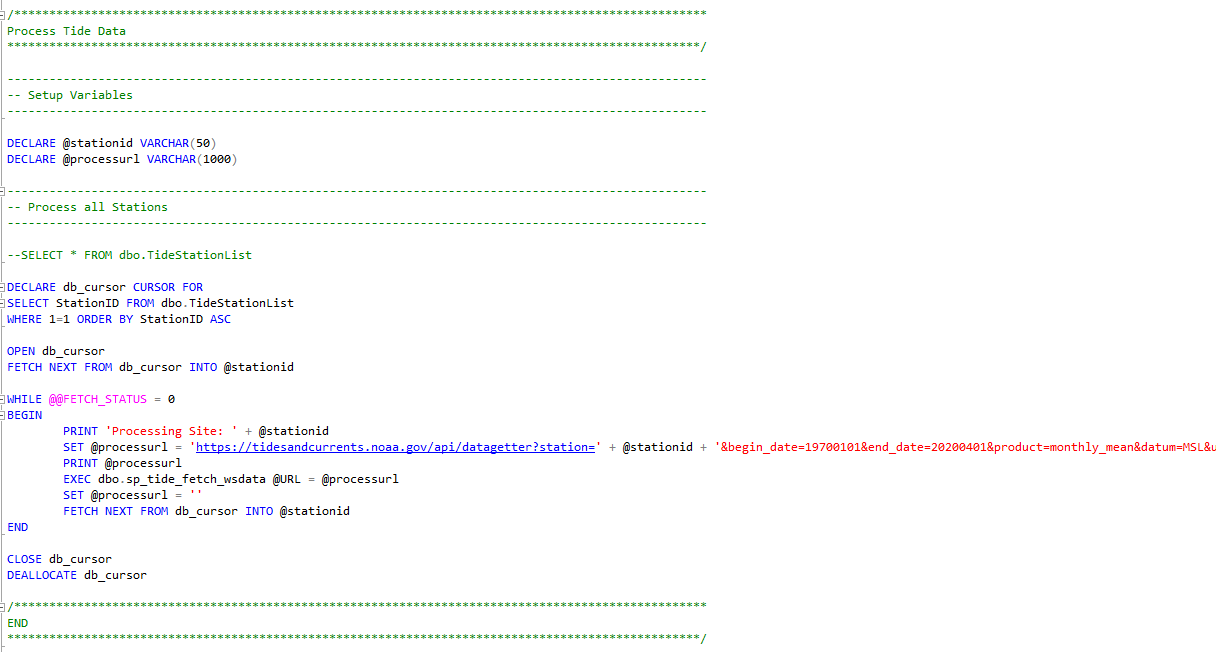
Below is a snipet example of the SQL script used to retrieve the Tide Gauge data.
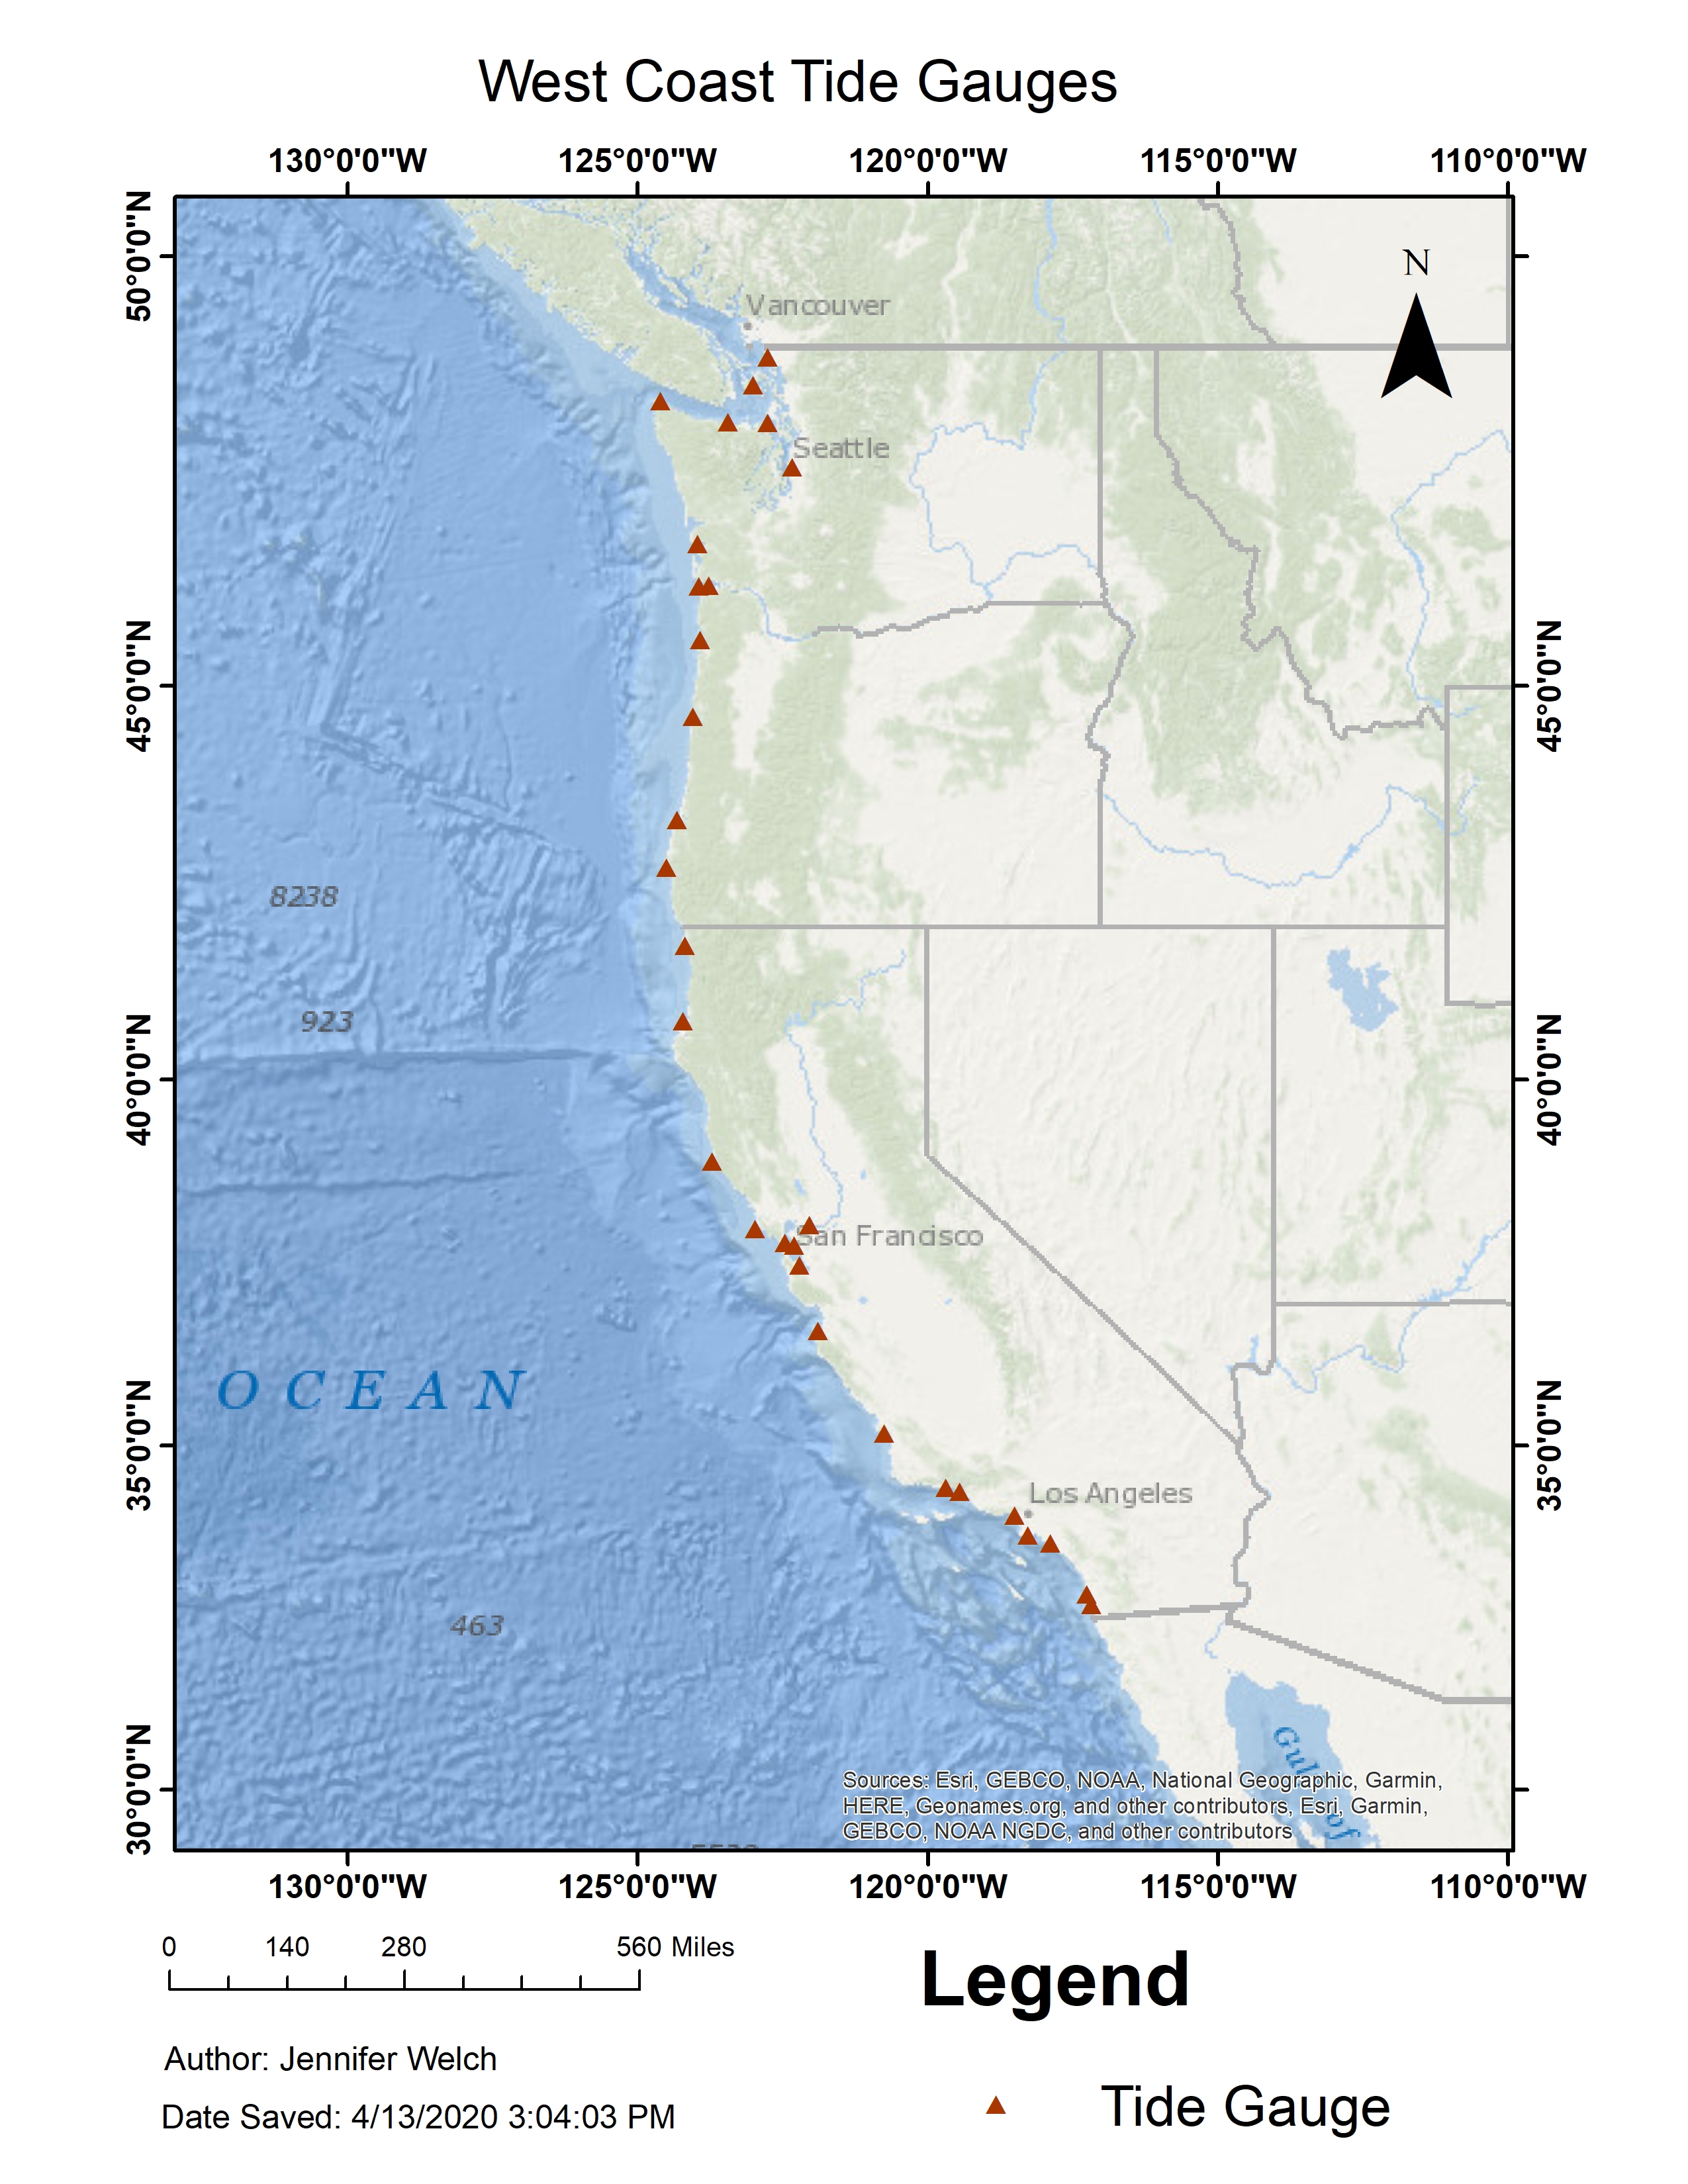
This map shows where the Tide Gauges are located off the West Coast of the United States.
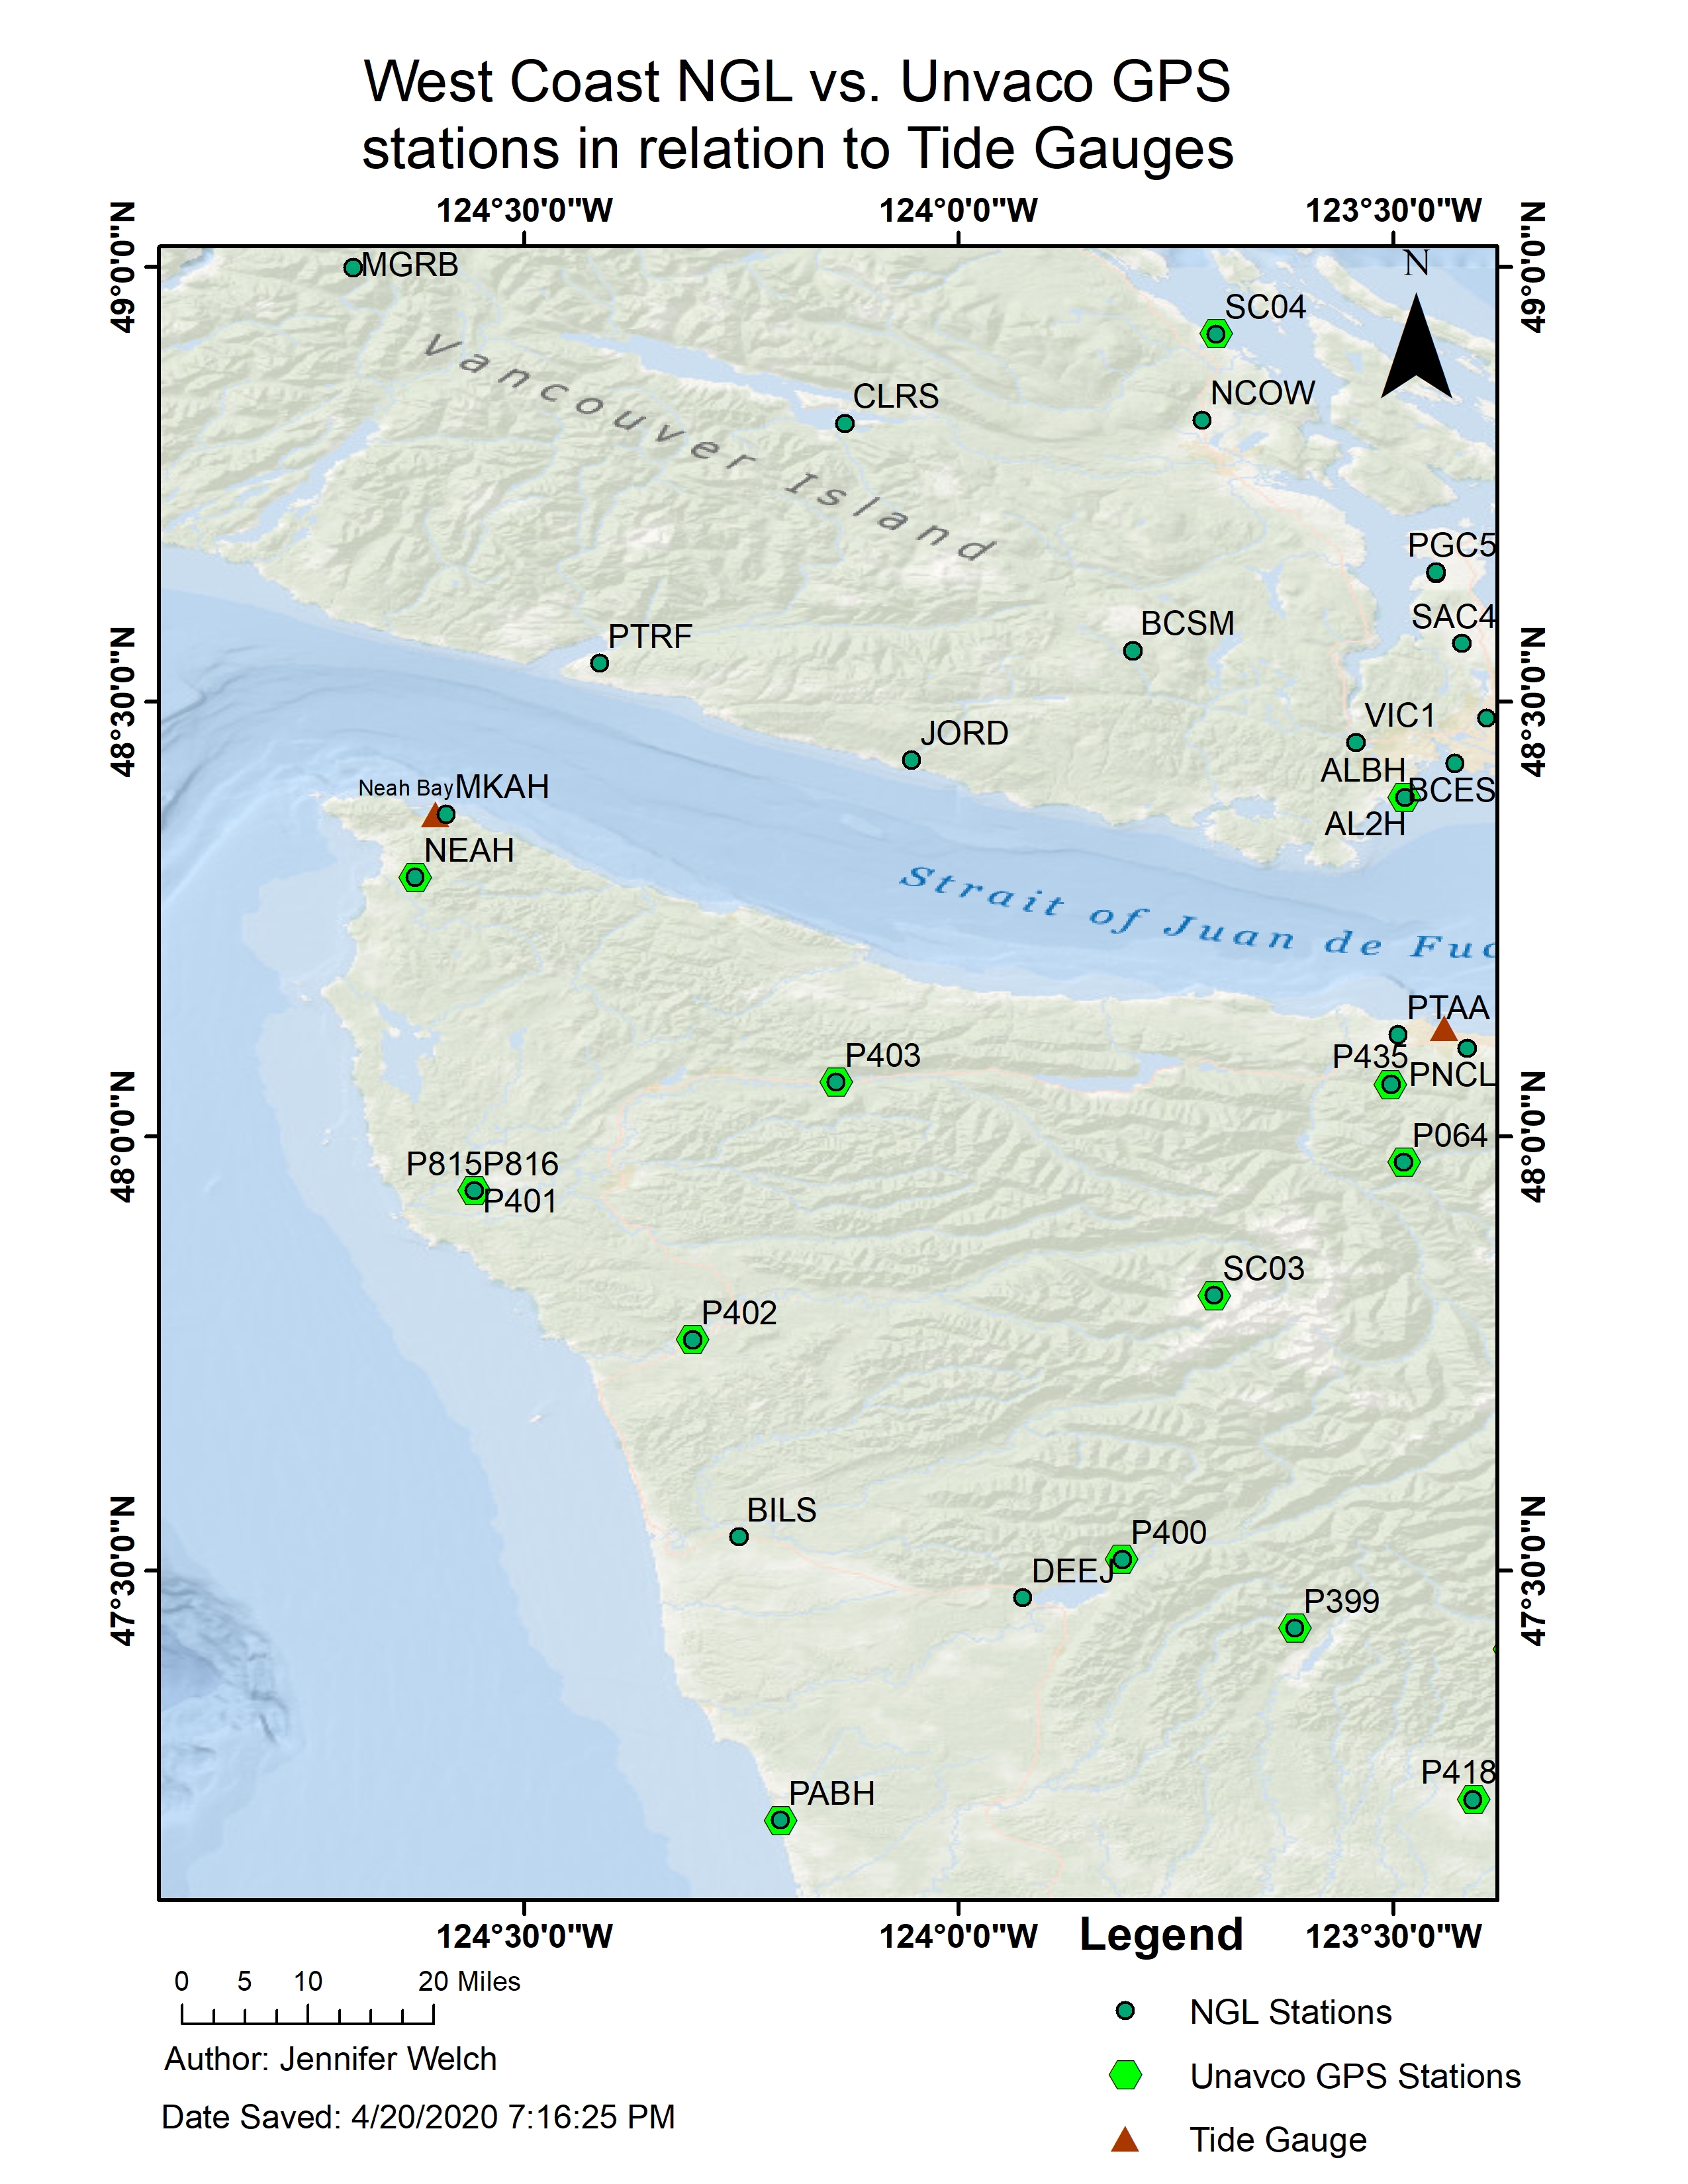
This map shows GPS Stations from both the NGL & UNAVCO datasets and Tide Gauges off the West Coast of the United States.
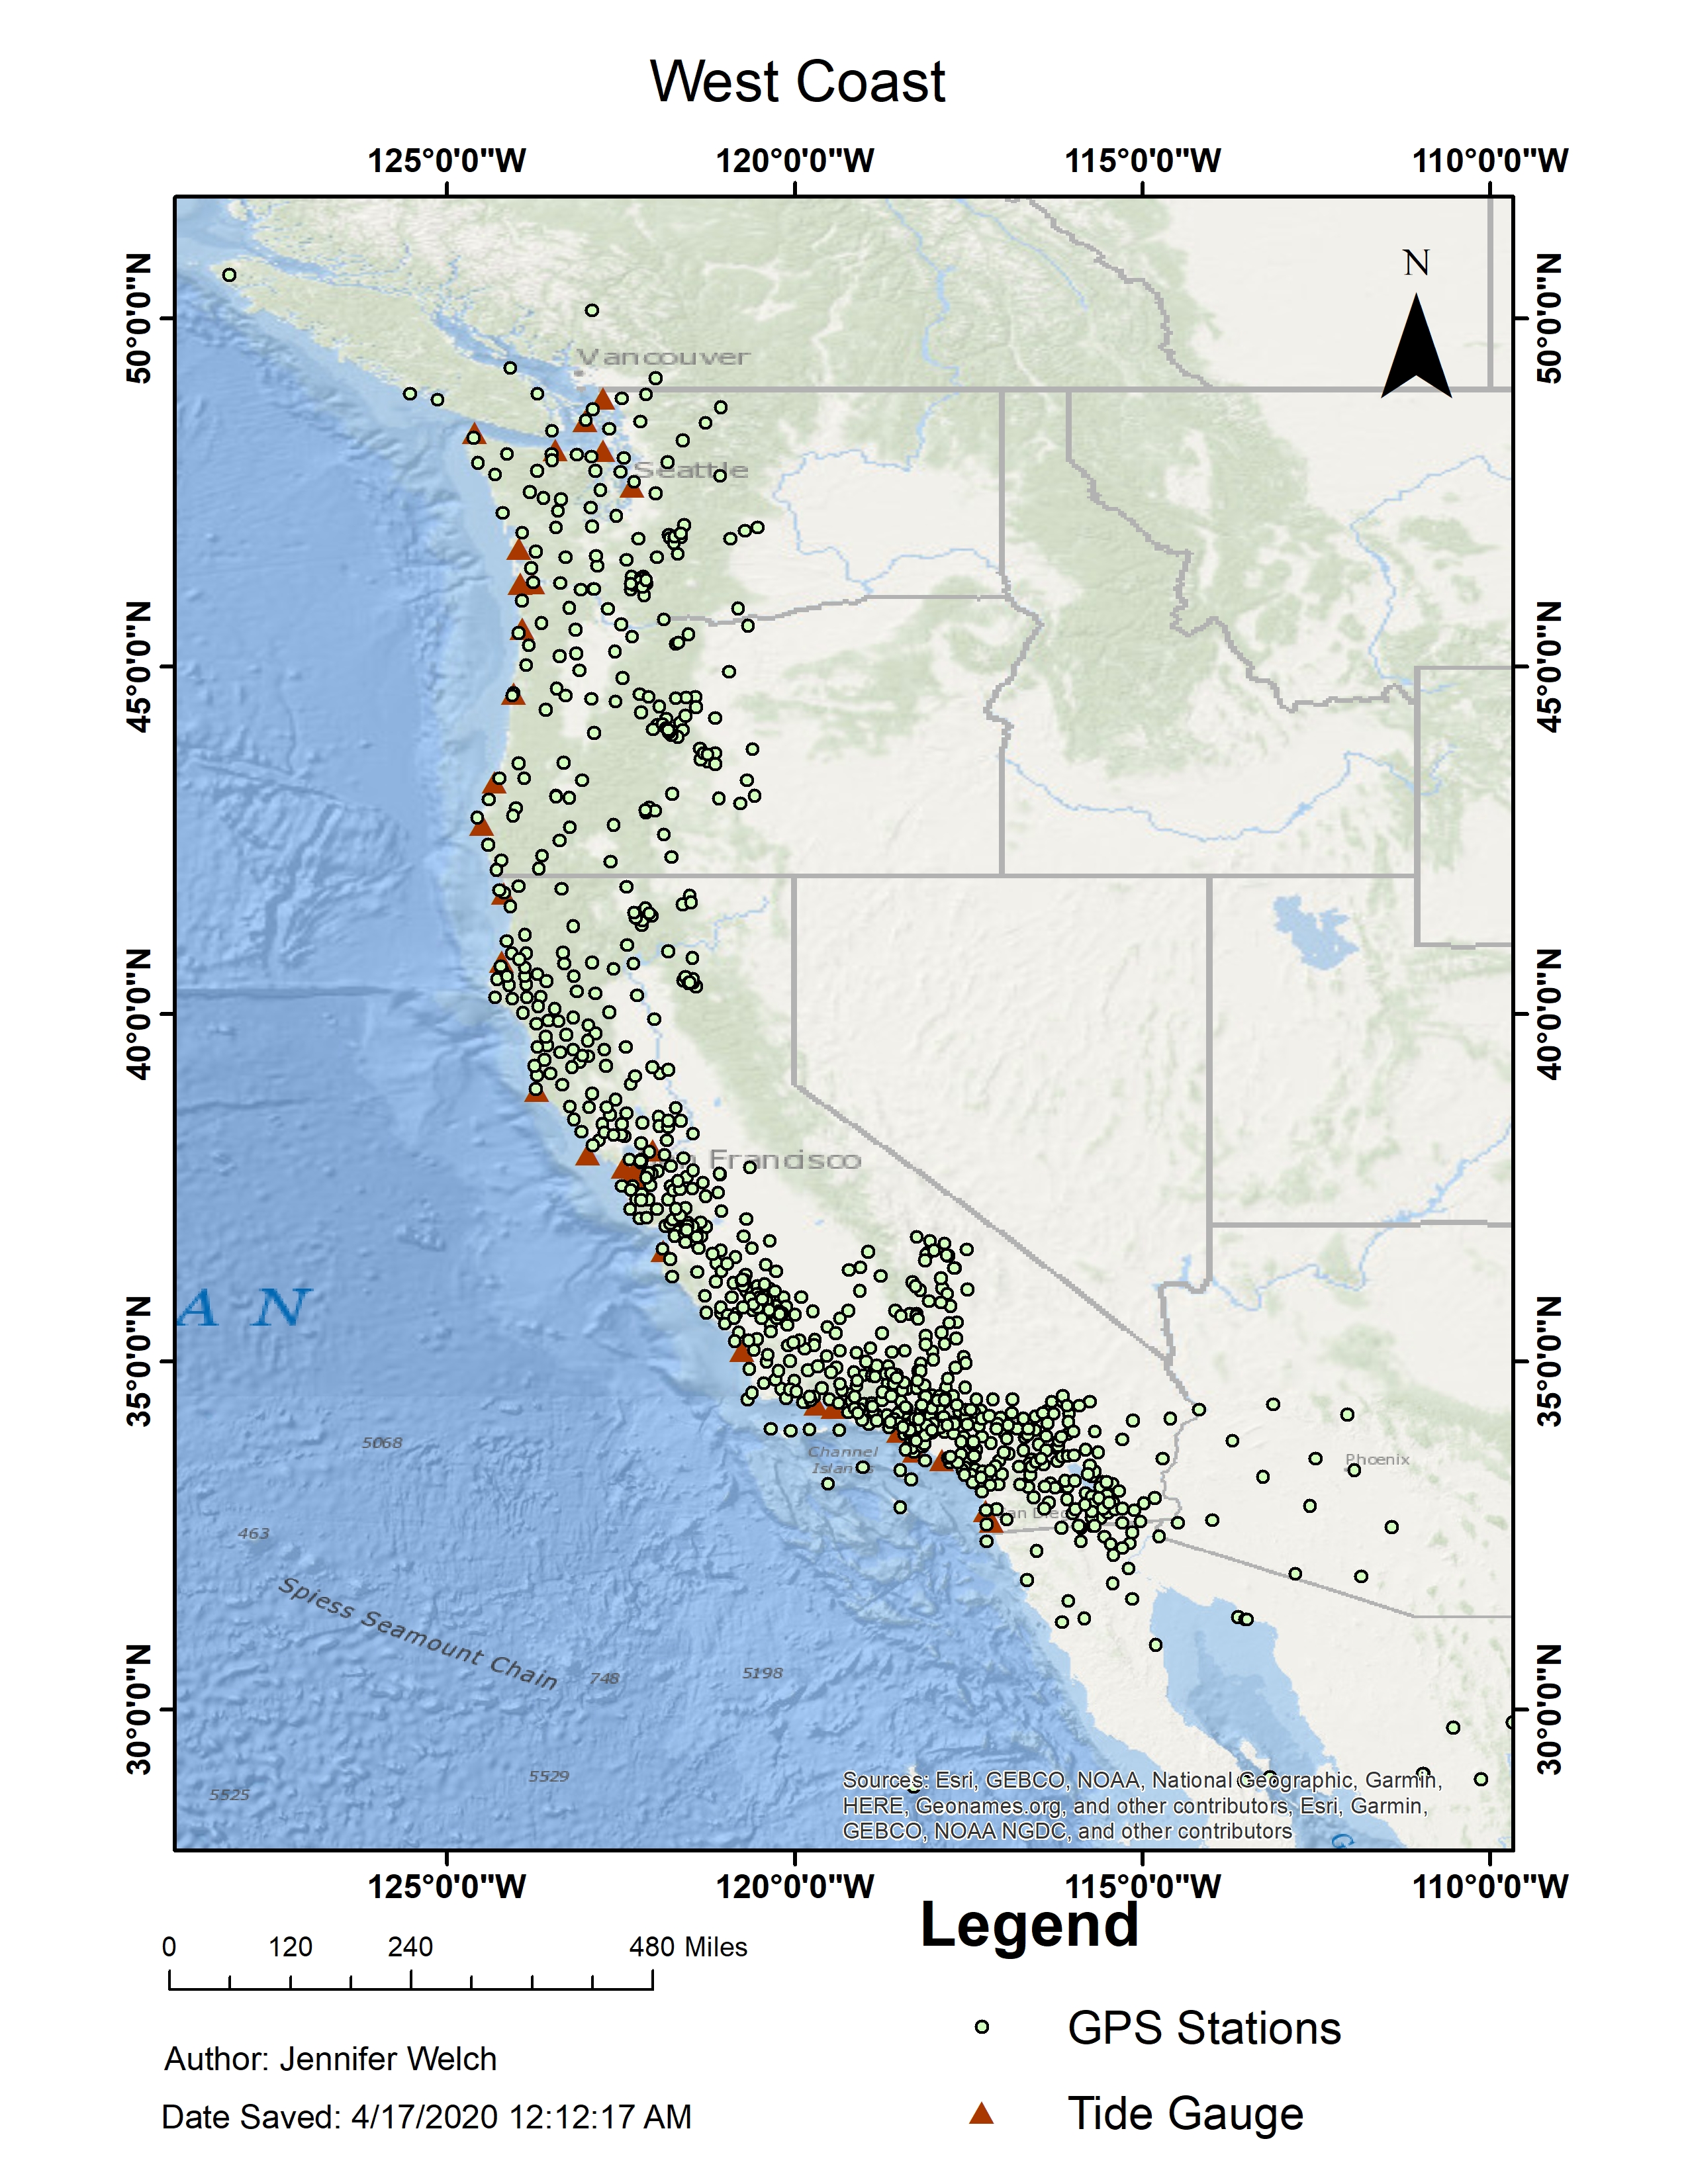
This map shows where the GPS Stations and Tide Gauges are located off the West Coast of the United States.
This map shows where the North Spit Tide Gauge and P162 GPS Station are located in reference to each other.
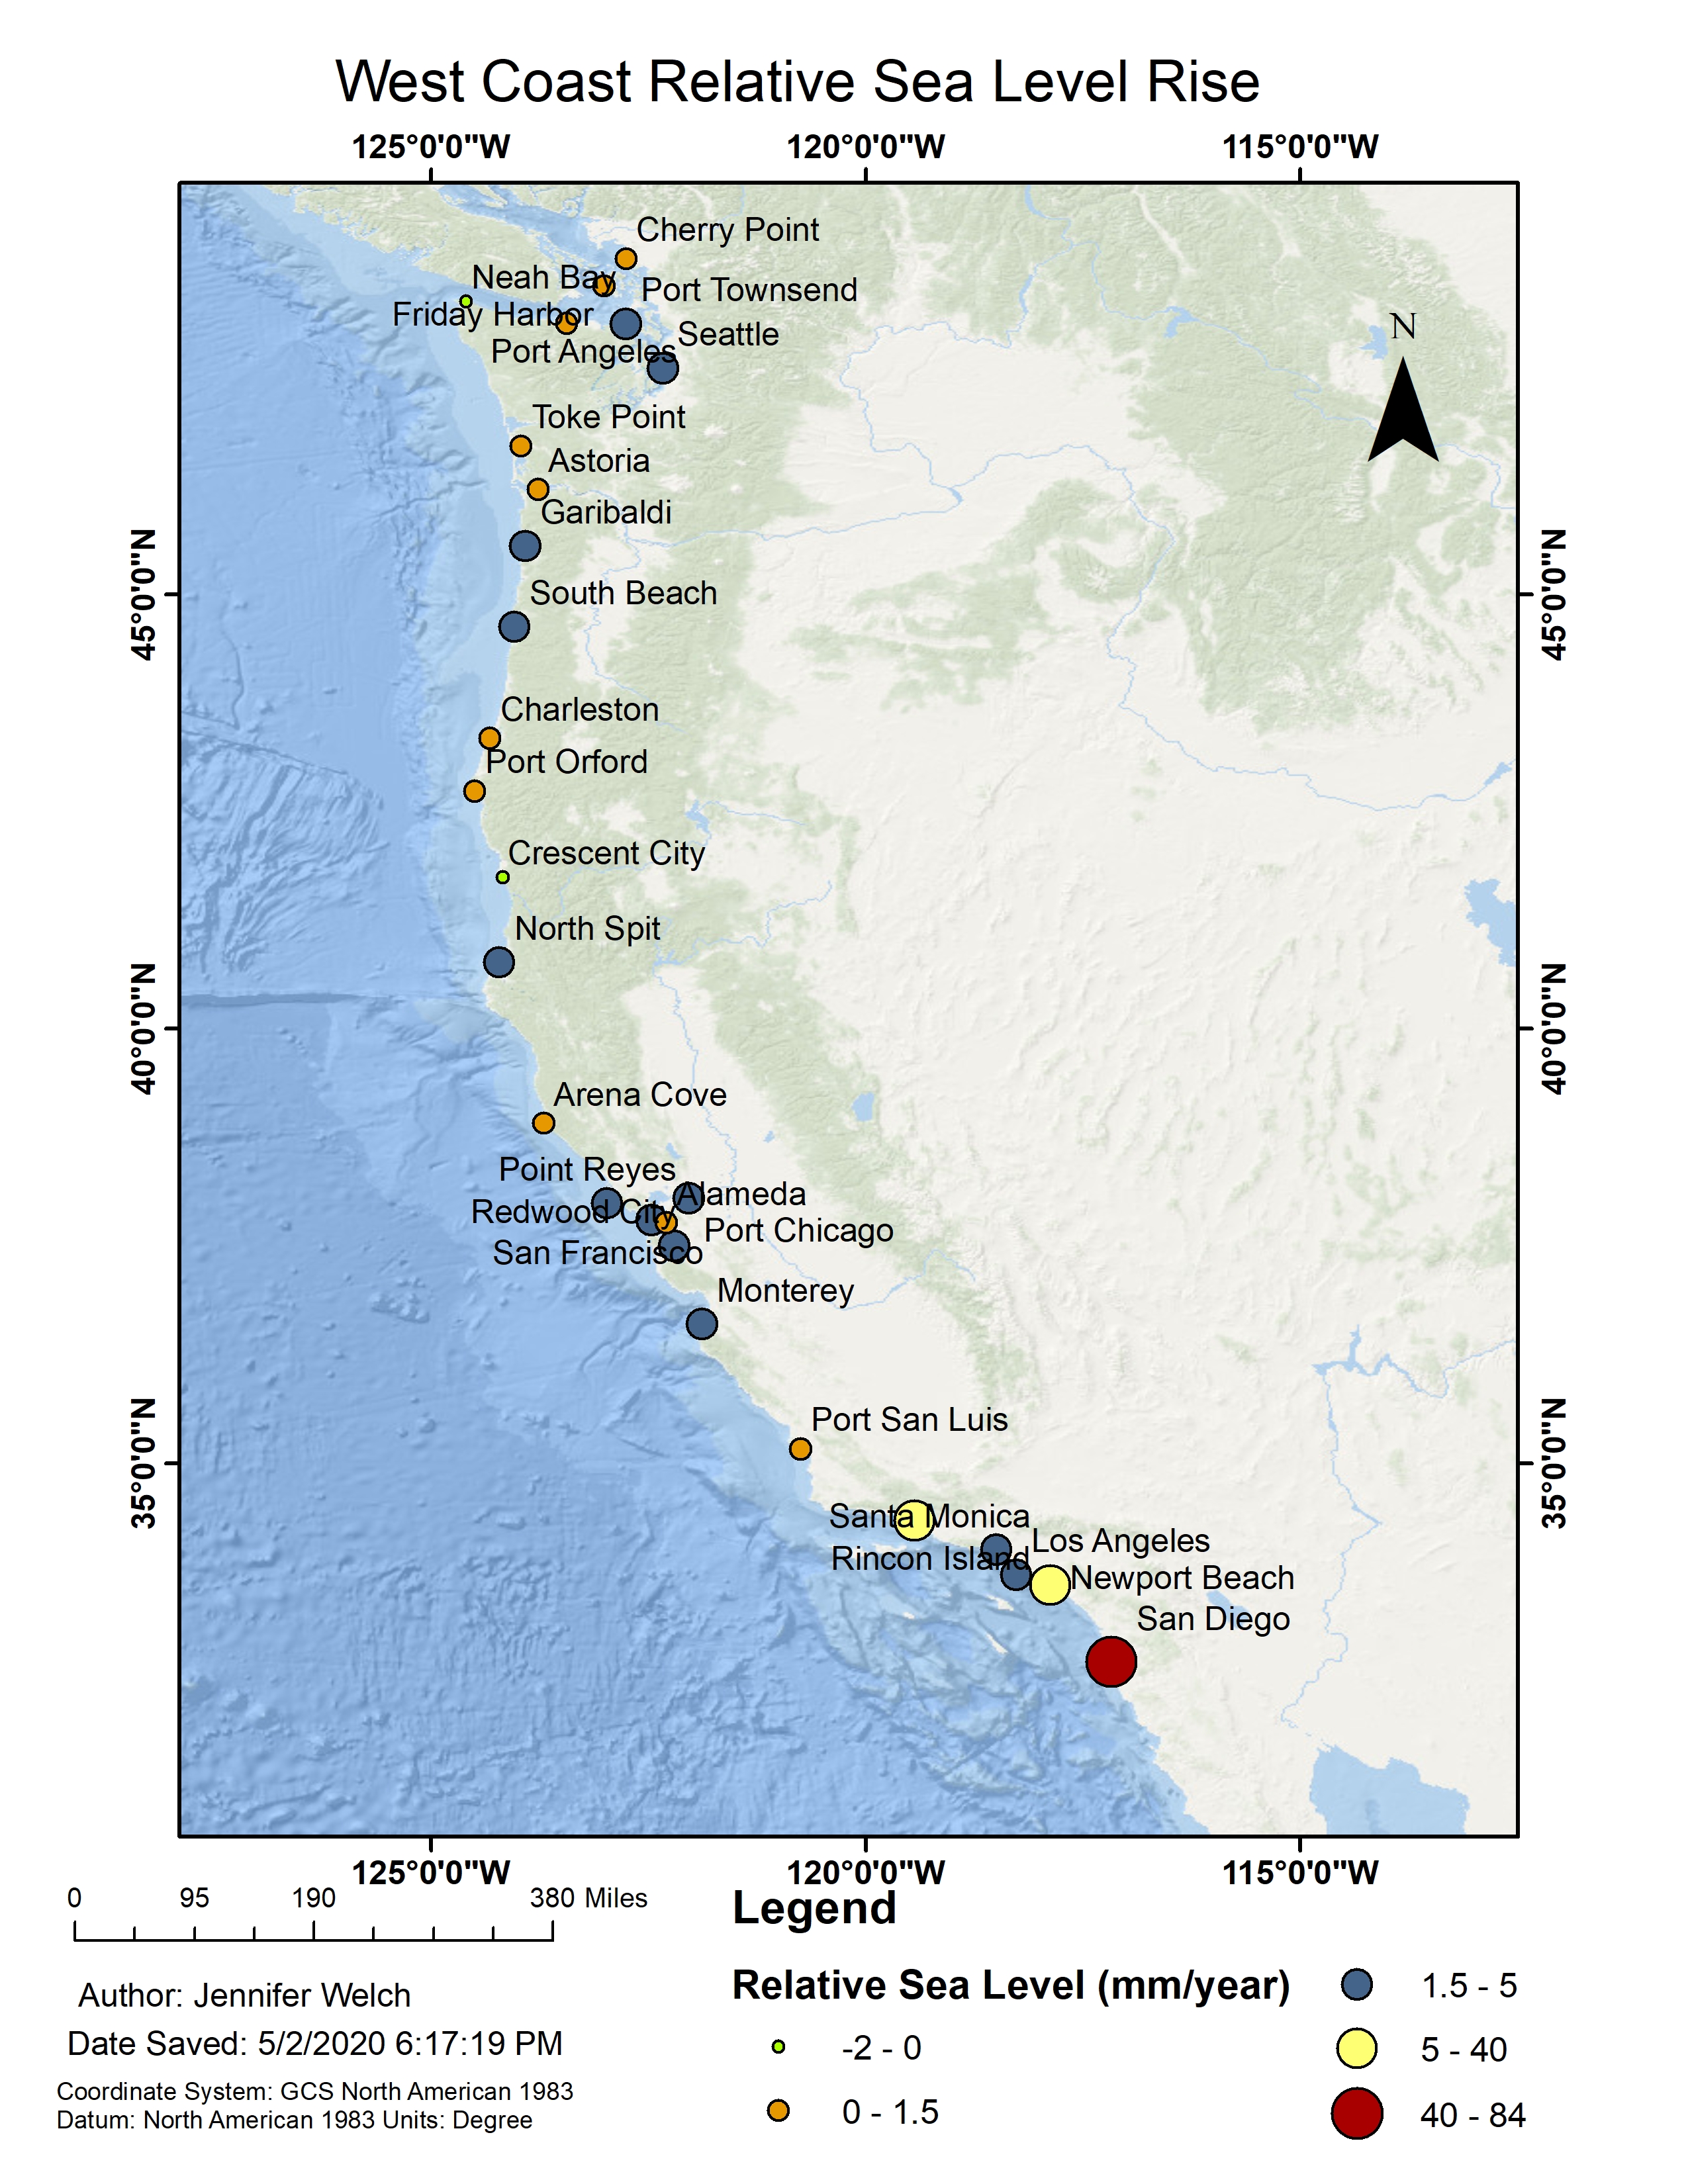
This map shows the West Coast Relative Sea Level Rise.
This map shows the West Coast Absolute Sea Level Rise.
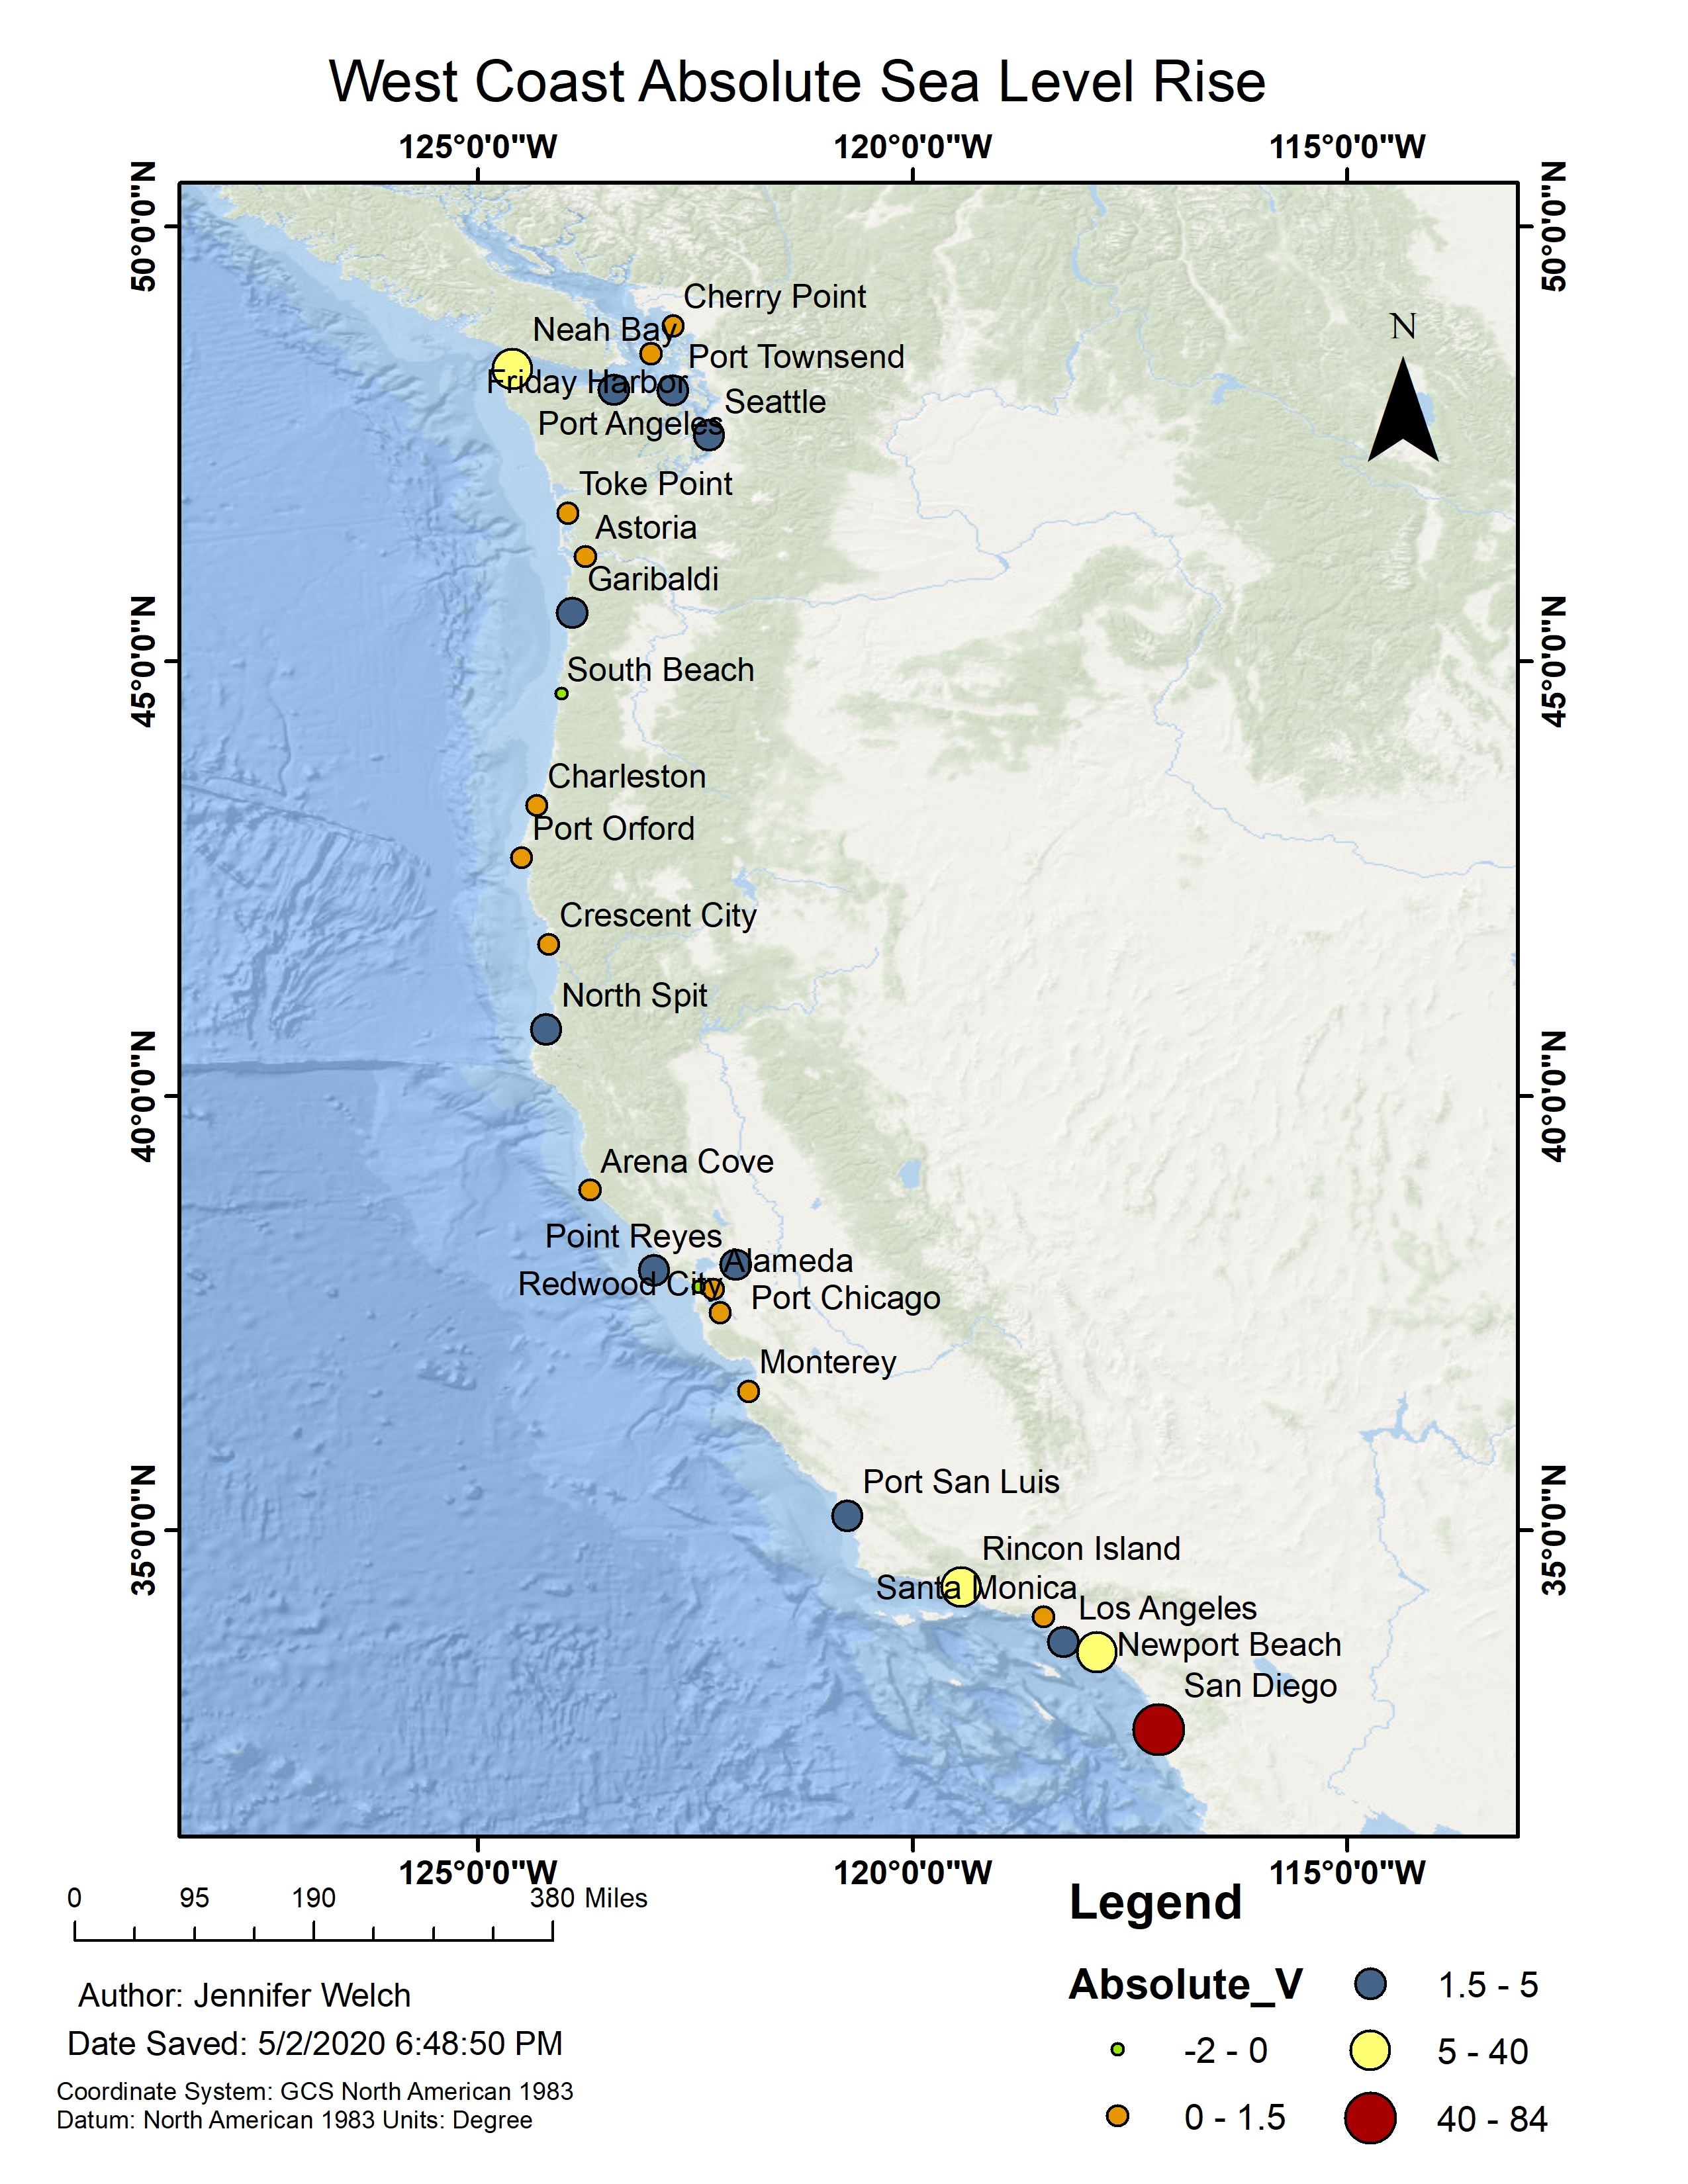


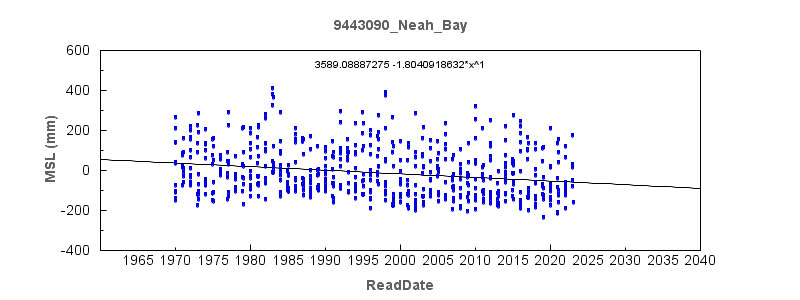
Absolute sea level was calculated using Tide Gauges and GPS stations along the West Coast. Relative sea level rise is minimal in the upper north west coast at places such as Neah Bay with -2-0 mm/year sea level fall. However, when the nearest GPS velocity is considered for the vertical land movement the absolute sea level rise for Neah Bay was higher at 5-40 mm/yea sea level. San Diego remains the area with the highest relative and absolute sea level rise.